The global social app market is booming, especially in the past two years, fueled by new technologies and innovative features that have breathed new life into this sector.
Grand View Research forecasts that the global social app market is set to continue its rapid expansion, with the market size projected to surpass $310.37 billion by 2030, maintaining an optimistic outlook with a compound annual growth rate (CAGR) of 26.2% from 2023 to 2030.
Chinese game developers have long been enthusiastic about social gaming's global expansion. From early exploration to the visible increase in star products, Chinese social gaming apps have blossomed worldwide. However, with more players entering the field, market competition is intensifying. How is the overseas social market performing currently? Which niche areas hold opportunities?
Diving deep into the 2024 Q3 overseas social app market, we'll analyze market size, overall ad spending, and top products, covering hot niches like "1v1", "live streaming", "voice chat rooms", and "dating", to observe the latest industry trends.
01/ Overseas Social App Market Overview
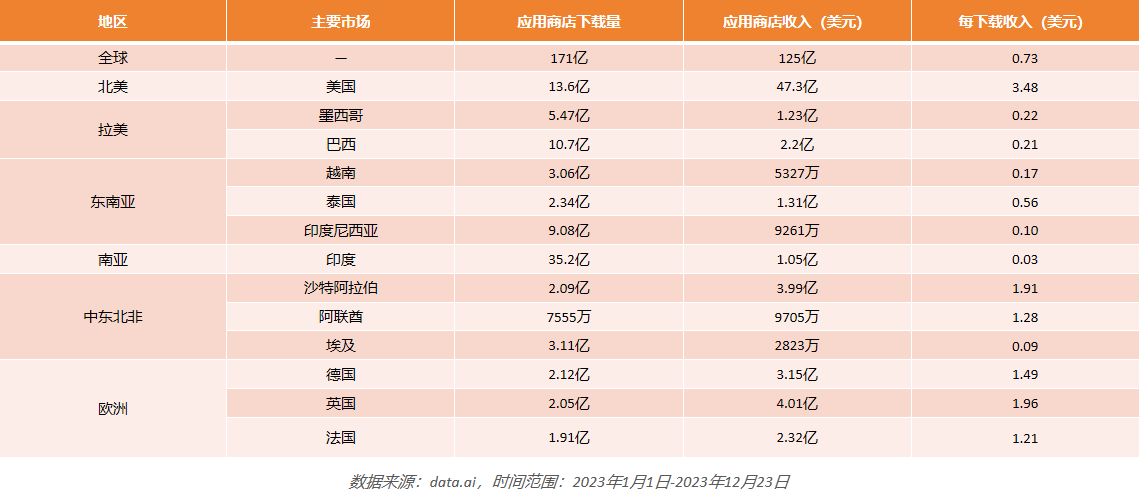
According to statistics, in 2023, global social app downloads hit 17.1 billion, with in-app purchase revenue reaching $12.5 billion, and the average revenue per download (RPD) stood at $0.73.
The U.S. remains the leading market for social apps globally, with 1.36 billion downloads and $4.73 billion in in-app purchases in 2023, averaging over $3 per downloader. Meanwhile, despite lower volumes, countries like Saudi Arabia and some in Europe show higher RPD, reflecting a strong user willingness to pay, making them key markets for growth.
In contrast, South and Southeast Asia boast substantial downloads but relatively lower revenue. For instance, Indonesia clocked in at 900 million downloads, yet the RPD is a mere $0.1; India's downloads soared to 3.52 billion, but the RPD is a mere $0.03. These regions hold certain market potential, but they also face monetization challenges.
02/ Social Ad Buying Analysis
On the acquisition front, social advertisers have seen a significant increase in numbers.
How's the performance of the existing market?
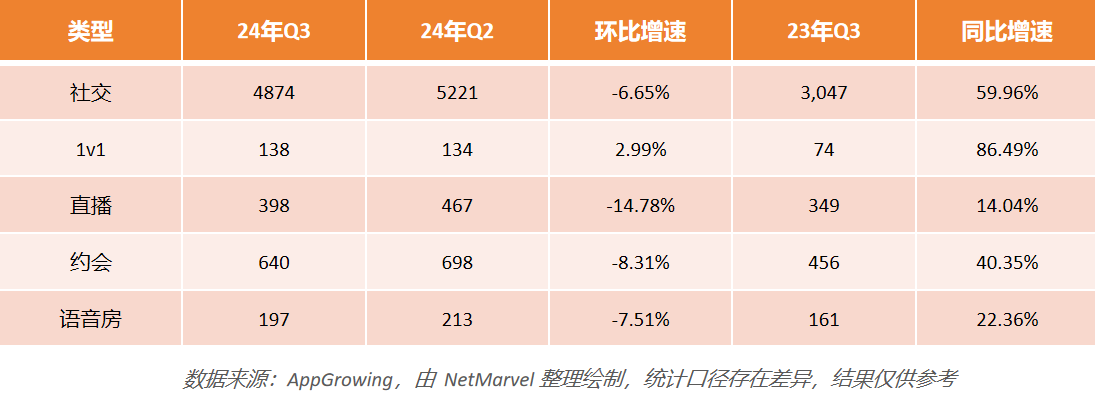
In Q3 2024, 1v1, live streaming, dating, and voice chat apps all posted positive year-over-year growth in active investments, with 138, 398, 640, and 197 apps respectively. The 1v1 category led with an 86.49% increase, while dating apps followed with a 40.35% rise. Compared to Q2 2024, all categories except 1v1 declined, with live streaming dropping the most at -14.78%.
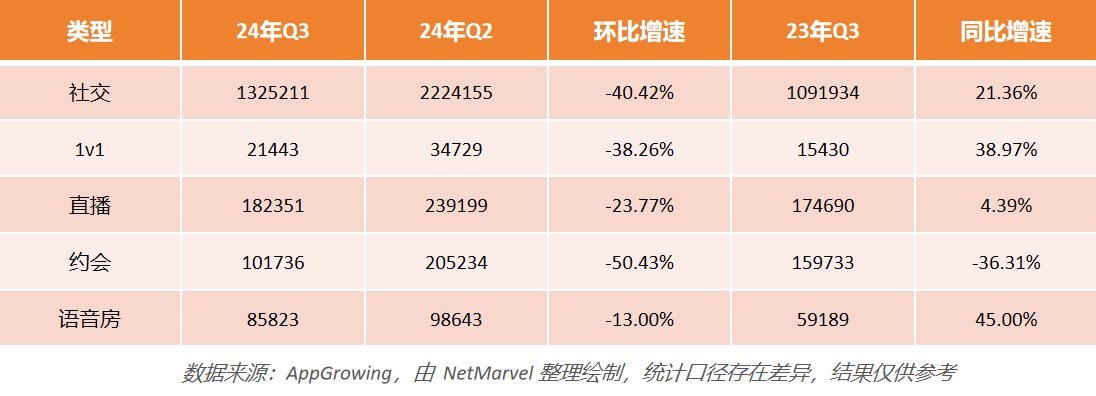
In Q3 2024, marketing costs for 1v1 and voice chat apps rose, with ad placements up 38.97% and 45.00% year-over-year, respectively. Live streaming ads grew slower than the number of products in the market, while dating ads saw a negative growth of -36.31%. Compared to Q2 2024, social app ad buys declined significantly across the board.
Despite positive growth across all four categories in 2024 compared to last year, live streaming and dating apps are more conservative in their ad spending, with the latter even seeing a negative growth in ad buys (-36.31%). In contrast, 1v1 and voice chat ads maintain growth in line with the number of apps in the market, indicating rapid expansion in these niches.
How's the growth in new markets?
Year-over-year, the number of new dating apps surged by 46.58%, totaling 107 apps, which is 16.7% of all social apps. However, new voice chat and live streaming products declined, with live streaming down the most at -26.19%. Quarterly, all four categories saw a drop in new app launches.
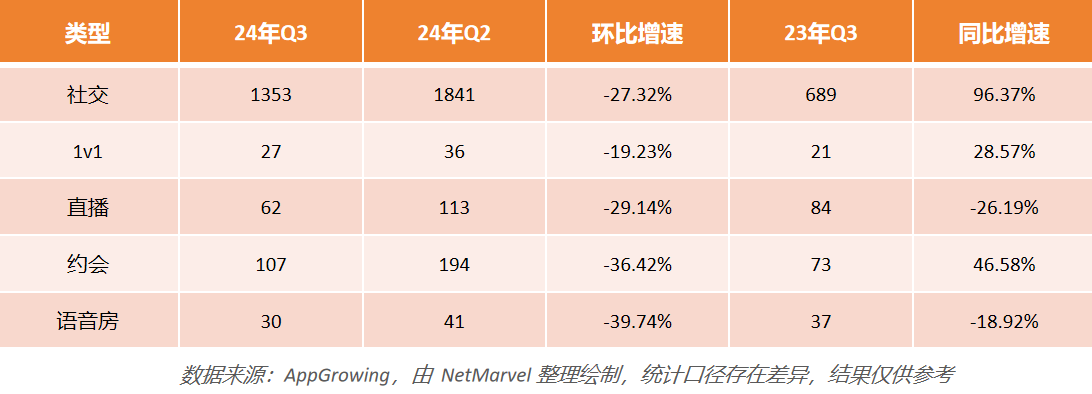
New ad campaigns show positive growth for 1v1 and voice chat categories year-over-year, while live streaming and dating ads see a decline, with dating experiencing a 47.05% drop. In Q3 2024, compared to the previous quarter, new ad campaigns across all four categories have decreased.
Dating apps saw a significant increase in new launches this year, but their ad budgets have taken a hit. In contrast, despite a slight dip in new additions, 1v1 and voice chat advertisers have ramped up their overall ad spend, with a more substantial average marketing investment.

How do social advertisers choose their buy-in channels?
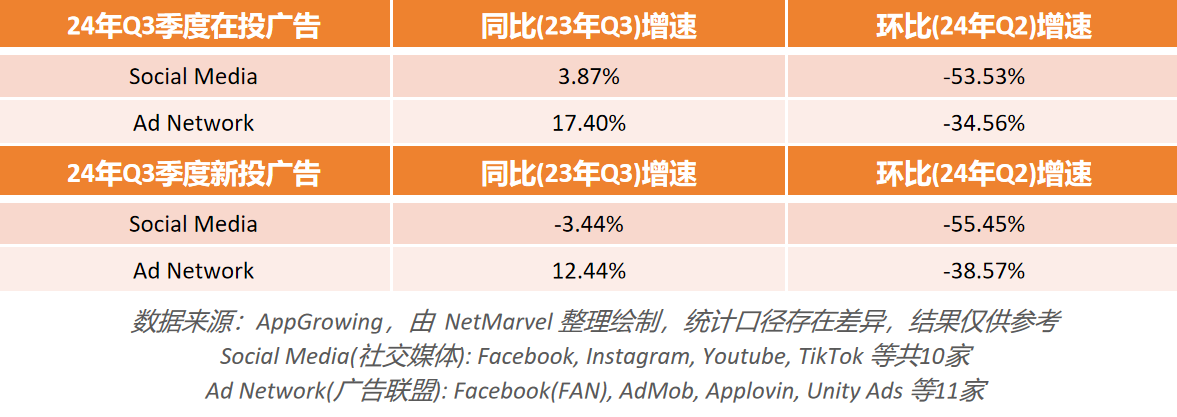
Social advertisers have significantly increased their ad spending on Ad Networks, while slowing down their investment on Social Media platforms, with a year-on-year decrease in new ad placements. Compared to mobile games and other types of apps, social advertisers adopt a more diversified strategy, often utilizing Media Placement Services to maximize ad reach across multiple networks.
03/ Top Ad Buying Products Analysis
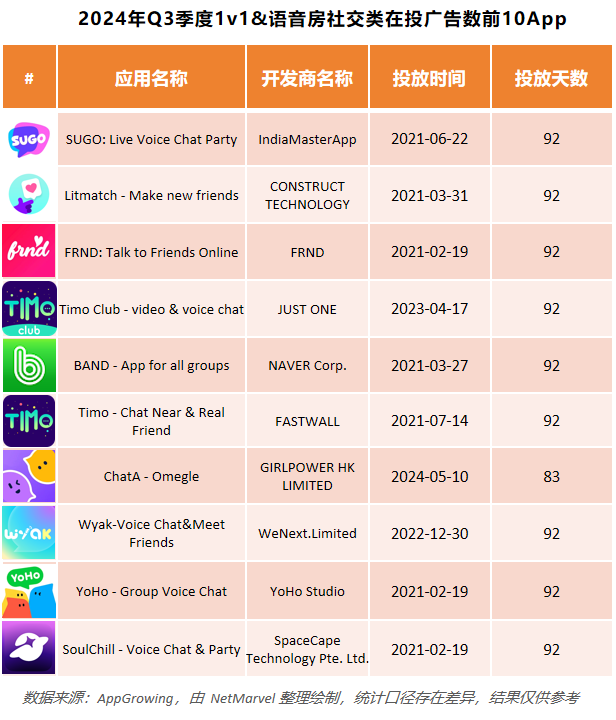
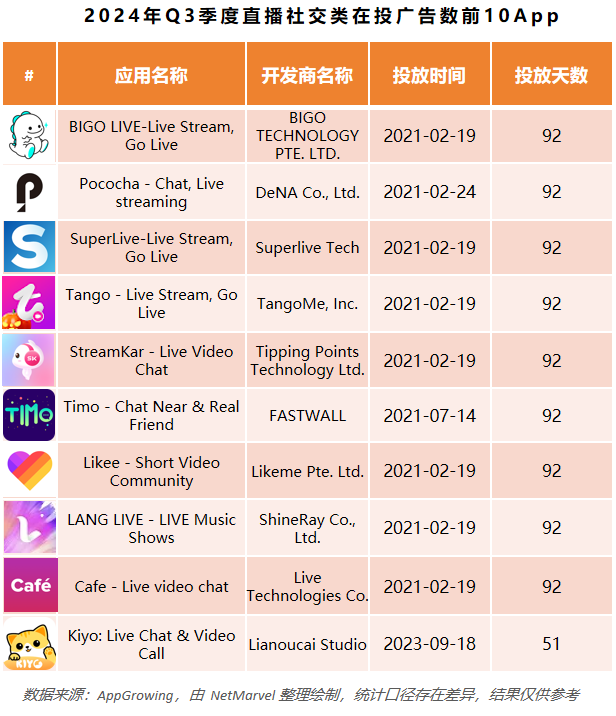
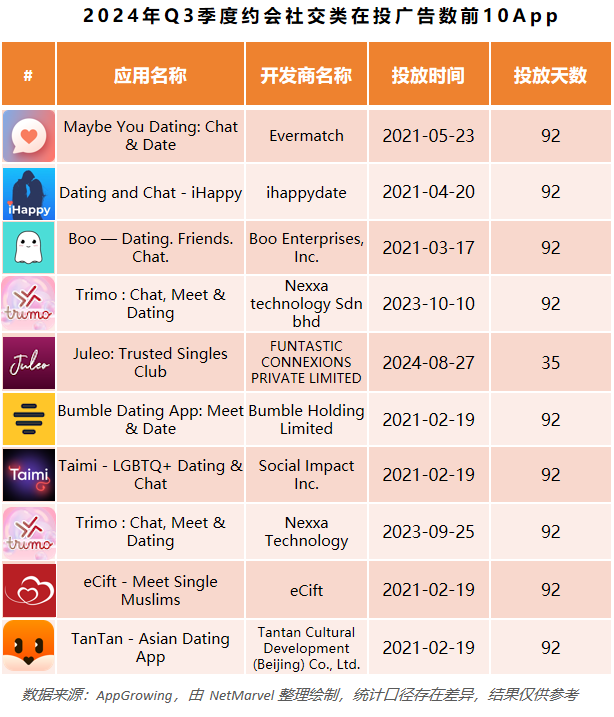
In Q3 2024, the top three 1v1 and voice chat apps in terms of ad spending were "SUGO," "Litmatch," and "FRND." For live streaming, the top three were "BIGO LIVE," "Pococha," and "SuperLive." In the dating category, the leaders were "Maybe You Dating," "Dating and Chat," and "Boo".
Overall, the top apps in 1v1 & voice chat, live streaming, and dating typically run 1,000-3,000 ads per quarter, with the top three apps pushing over 5,000 ads. Dating app "Maybe You Dating" notably launched 10,285 ads in Q3, while "BIGO LIVE" topped with 82,357 ads.
