

Mobile Game UA Insights: How to Optimize Campaigns with Deeper User Value Metrics


As global mobile game downloads continue to face pressure while advertising investment keeps rising, mobile marketing is confronting a new question: Does acquiring more users still mean achieving better growth?
For mobile game advertisers, the answer is becoming increasingly complex. As market competition intensifies, evaluating campaign performance solely through installs, cost per install (CPI), and first-day conversions no longer provides a complete picture of user value. Whether users remain active, make repeat purchases, and generate enough long-term revenue to cover acquisition costs has become increasingly important in user acquisition (UA) decisions.
Against this backdrop, analyzing deeper, outcome-based user value metrics is becoming essential. These metrics help advertisers understand not only which channels bring in users, but also which users are worth continued investment and how to generate more sustainable returns from acquisition budgets.
1. Why Are Installs No Longer the Only Measure of UA Performance?
According to Sensor Tower, global mobile game downloads fell 12% year over year to approximately 24 billion in H1 2026, while total in-app purchase (IAP) revenue remained relatively stable at around $40 billion. Meanwhile, mobile game advertising spend increased 8% year over year to approximately $7 billion.
On one hand, new mobile game installs are declining, while IAP revenue growth is also facing pressure. On the other, advertising investment and impressions continue to rise, showing that competition for users remains intense. With new user acquisition becoming more challenging, focusing solely on install volume is no longer sufficient to sustain growth. Advertisers need to pay closer attention to retention, monetization performance, and long-term user value.
Traditionally, UA teams have focused on installs, CPI, click-through rate (CTR), and conversion rate (CVR) to evaluate the short-term performance of creatives, channels, and campaign strategies. These metrics remain important, but they primarily measure acquisition efficiency. On their own, they cannot explain how users behave after installing a game.

For example, a channel may deliver a large volume of installs at a low cost, but if users quickly churn and generate little subsequent IAP or ad revenue, a low CPI does not necessarily translate into a higher return on investment.
Conversely, some channels may have higher acquisition costs but deliver stronger retention and greater lifetime revenue, potentially generating better long-term returns.
Therefore, UA optimization should move beyond simply lowering acquisition costs toward evaluating the actual value of acquired users. Post-install performance data provides an important link between these two objectives.
2. Which Deeper Marketing Metrics Deserve More Attention?
Post-install data does not refer to a single metric. It encompasses a range of indicators covering user activity, key in-app actions, payments, and monetization performance. Advertisers need to build a measurement framework aligned with their products' business models and growth objectives.
2.1 Look Beyond First-Week Performance to D30 Retention and ROAS
D1 and D7 retention help advertisers understand early user engagement. However, short-term retention does not necessarily reflect long-term user value.
For mobile games with longer lifecycles, D30 retention and D30 ROAS (30-day return on ad spend) offer additional perspectives on user quality and monetization performance.
D30 Retention: Measures the percentage of users who remain active 30 days after installation. It helps assess whether acquired users have the potential to stay engaged.
D30 ROAS: Measures the revenue generated within 30 days after installation relative to acquisition costs. It helps evaluate short-term monetization returns over a defined period.
LTV (Lifetime Value): Estimates the revenue a user may generate throughout their entire lifecycle, providing a basis for long-term acquisition cost and budget planning.
Payback Period: Measures how long it takes for cumulative revenue to cover acquisition costs, helping advertisers evaluate capital efficiency and opportunities to scale campaigns.
Of course, D30 is not a universal benchmark for every game. For casual games with faster monetization cycles, early returns may be more relevant. Mid-core and hardcore games may require longer observation periods. The appropriate measurement window should reflect each product's retention patterns, payment cycles, and payback targets.
2.2 Move from One-Time User Value to Repeat Value
A first purchase is an important signal of commercial value, but it does not necessarily indicate a user's ability or willingness to continue spending.
If campaign optimization focuses only on first-time purchases, advertisers may acquire users who complete an initial transaction but rarely make additional purchases. As campaign volume scales, this gap can have an increasingly significant impact on long-term returns.
Beyond first purchases, advertisers should track repeat purchase rates, cumulative spending, purchase frequency, and subsequent revenue across different payer cohorts to understand whether spending behavior is sustainable.
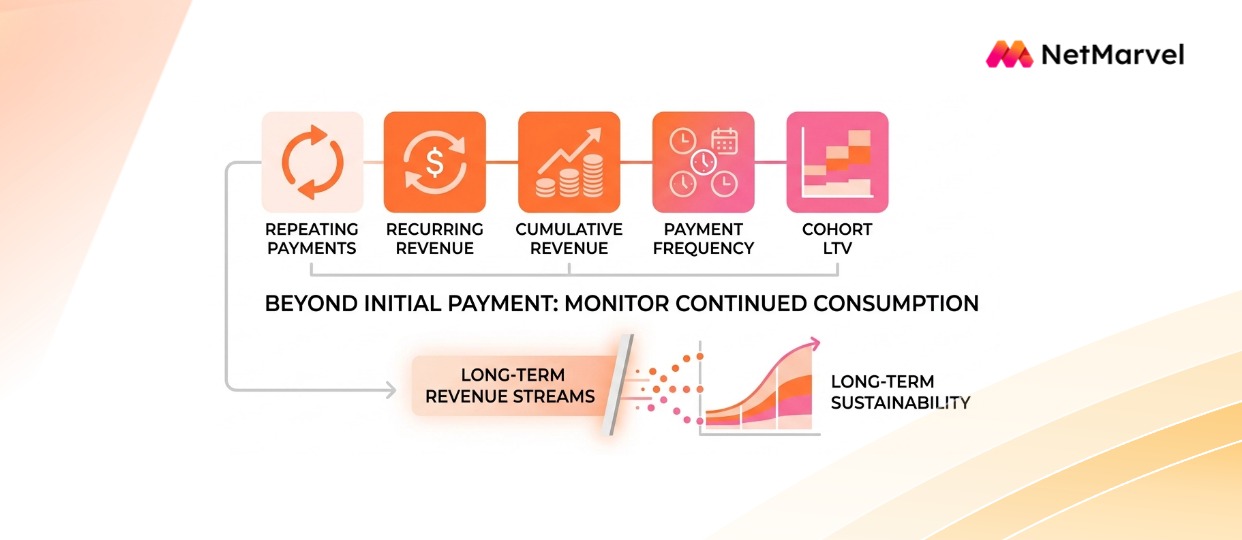
For ad-monetized games, ad viewing frequency, ad revenue per user, and long-term activity are also worth monitoring. For hybrid-monetization games, IAP and advertising revenue should be evaluated together to avoid assessing user value through only one revenue stream.
However, optimizing for deeper events does not automatically improve campaign performance. When deeper conversion events occur infrequently, advertising platforms may not receive enough signals to optimize effectively. Advertisers should therefore consider event volume, postback quality, and campaign scale when gradually testing optimization objectives, moving from installs to key in-app actions and deeper monetization events.
2.3 Shift from Comparing Channel Install Volume to Analyzing User Quality
Users acquired through different channels, creatives, regions, and operating systems may exhibit significantly different behavioral patterns.
Comparing CPI alone can cause advertisers to overlook these differences. Post-install analysis should therefore break down user sources and compare retention, payment behavior, and revenue performance across channels.
For example, consider a mobile game running campaigns across two channels:
Metric |
Channel A |
Channel B |
|---|---|---|
CPI |
$1.00 |
$1.50 |
D30 ROAS |
20% |
45% |
Note: These figures are hypothetical and are used only to illustrate the analytical approach. They are not actual industry statistics.
Based on CPI, Channel A has a lower acquisition cost. However, Channel B delivers stronger 30-day returns, as reflected in its higher D30 ROAS.
This illustrates why lower-cost traffic is not necessarily the better choice. However, D30 ROAS should not be used as the sole basis for budget allocation. Advertisers also need to consider revenue measurement standards, long-term LTV, payback targets, traffic volume, and marginal acquisition costs as campaigns scale.
Only by evaluating multiple metrics together can advertisers more accurately identify high-value acquisition channels.
3. How to Use Deeper Marketing Data to Optimize UA
The value of data lies not only in explaining past performance, but also in guiding future decisions. For UA teams, post-install analysis can inform campaign strategies in at least four ways.
3.1 Reassess Acquisition Channels and Budget Allocation
Compare user cohorts across different media sources and campaigns to identify low-cost traffic with weak retention, as well as higher-cost channels that deliver stronger long-term returns.
Budget adjustments should be based on mature cohort data and marginal return analysis, rather than simply pursuing the lowest CPI.
3.2 Extend Creative Optimization to User Quality
Creatives influence not only whether users click and install, but also their expectations of a game's mechanics, content, and overall experience. If an ad creates expectations that differ significantly from the actual gameplay, campaigns may achieve strong initial conversion rates but experience higher subsequent churn.
Advertisers can segment user cohorts by creative theme, gameplay presentation, and storytelling approach, then compare metrics such as D7 retention and D30 ROAS across different creatives.
By identifying the creative directions that attract users who are more likely to engage with the actual game, advertisers can refine their creative iteration strategies instead of simply selecting assets with the highest install conversion rates.
3.3 Adjust Campaign Strategies Based on Regional and Platform Differences
Users in different countries and regions may vary in acquisition costs, spending power, and ad monetization performance. Similarly, iOS and Android users should not automatically be evaluated using the same benchmarks.
By segmenting data by region, operating system, and acquisition channel, advertisers can identify promising market segments and adjust budgets and optimization objectives to match their product positioning.
However, conclusions should not be drawn too early when sample sizes are insufficient or user cohorts have not yet matured.

3.4 Build a Data Feedback Loop to Integrate Deeper Analysis into Growth Decisions
The ultimate value of deeper user journey data is not to increase the number of metrics in a dashboard, but to make data an integral part of UA decision-making. Achieving this requires a complete data feedback loop.
First, define business objectives and key events. Based on the product's monetization model, determine which user actions need to be tracked, while establishing consistent event definitions, revenue measurement standards, and attribution methodologies.
Second, build a tiered measurement framework. Use CPI and install conversion rates to evaluate acquisition efficiency, D7 retention and deeper conversion events to assess user quality, and D30 ROAS, LTV, and payback periods to measure long-term returns.
Next, feed analytical findings back into campaign execution. Adjust budgets, bids, and creative strategies through channel comparisons, creative-level cohort analysis, and regional segmentation, then continuously measure the impact of these changes.
Finally, ensure data comparability. Attribution rules, revenue measurement methods, and data maturity may vary across channels. Without consistent measurement standards, even a comprehensive set of metrics can lead to inaccurate budget decisions.
It is particularly important to note that D30 data only becomes a complete reference point once the corresponding user cohort has completed its 30-day observation period. For immature cohorts, advertisers should make interim assessments using early indicators and revisit their conclusions as additional data becomes available.
4. Conclusion
As global mobile game downloads come under pressure and advertising competition intensifies, the logic of UA growth is shifting. The focus is moving beyond install volume toward sustained user engagement and long-term value.
For advertisers, the goal is not to track as many metrics as possible. It is to establish a measurement framework that connects acquisition, user behavior, and long-term returns, ensuring that every optimization decision is more closely aligned with actual business objectives.