Global Financial App Data Insights: Downloads Exceed 7 Billion, North America Has the Highest CPA Costs

In recent years, the global mobile financial app market has been booming. In 2024, global financial app downloads surpassed 7 billion, showing users' desire for convenient, 24/7 financial services. Here's an in-depth analysis of overseas mobile financial app marketing data.
Global Financial App Market Overview
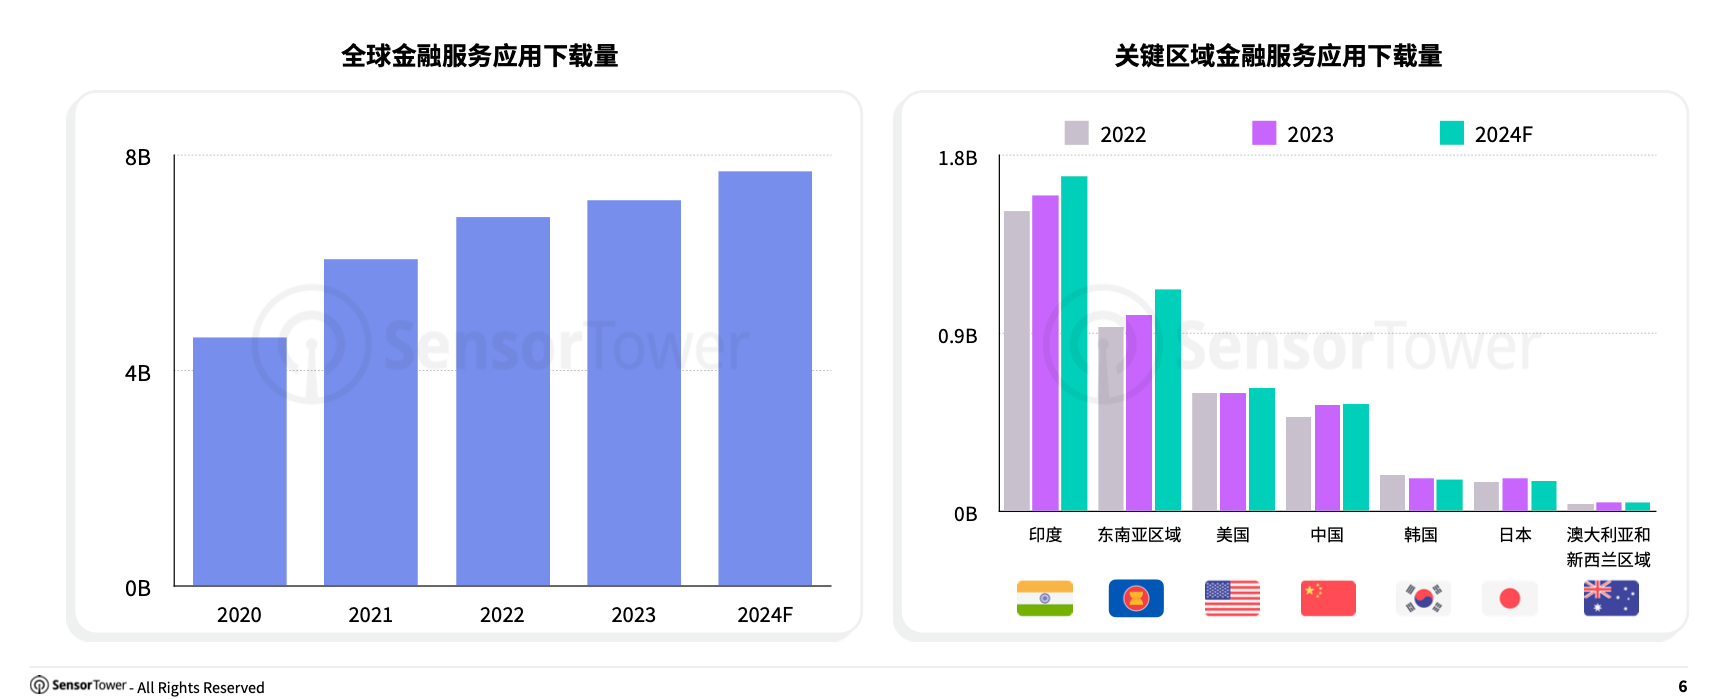
From 2020 to 2024, global financial app demand surged. Downloads rose from 4.6 billion in 2020 to an estimated 7.7 billion in 2024. India led with nearly 1.8 billion downloads in 2024. Southeast Asia and the US also grew strongly, while China and other regions stayed stable.
The global mobile financial market is now diverse, integrated, and intelligent, covering banking, payments, investment, insurance, and credit scoring.
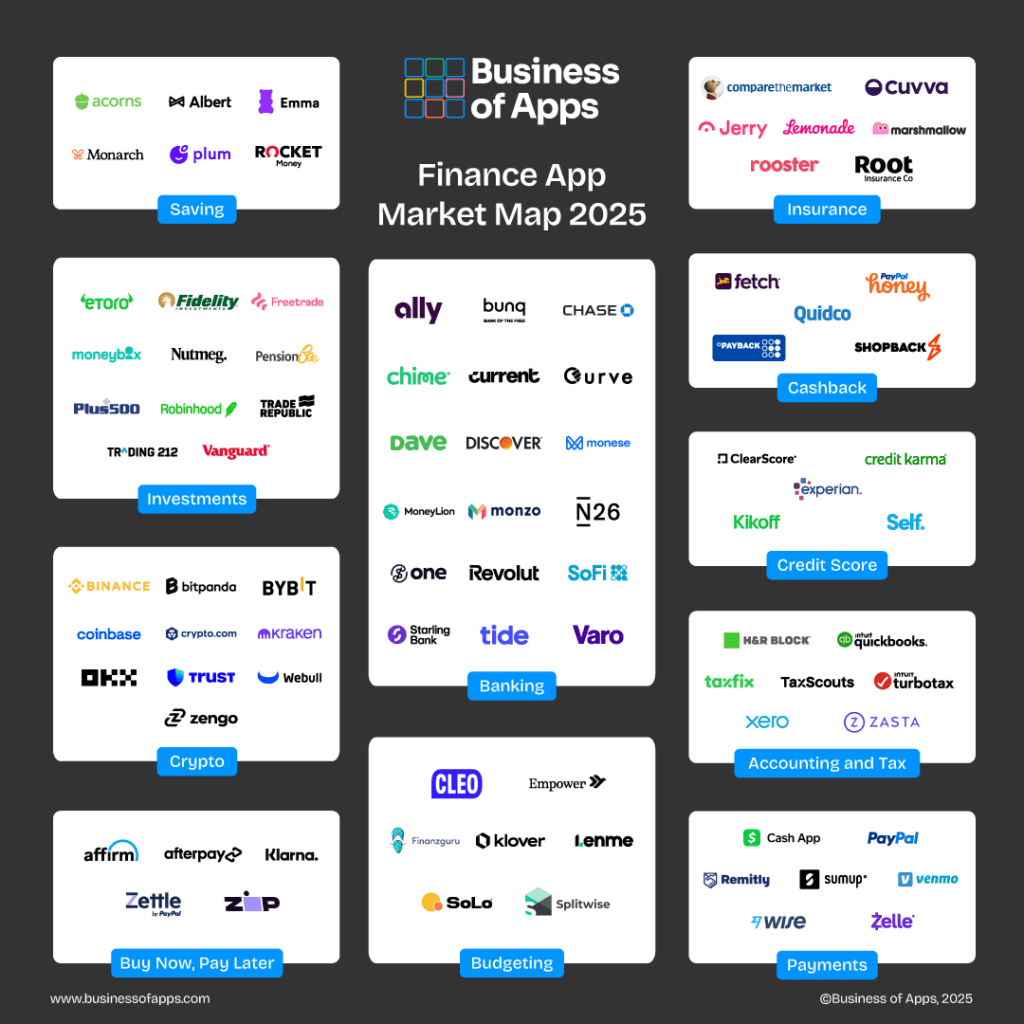
Popular Financial App Segments and Key Players:
- Banking: Offers mobile banking services without physical branches. Examples: Chime, SoFi, Current (US); Revolut, Monzo, N26 (Europe); Tide, Starling Bank (business customers).
- Budgeting: Helps users create and track budgets. Examples: Cleo, Empower, Klover (early wage access); Splitwise, Finanzguru (bill and expense tracking).
- Saving & Investments: Assists with saving, investing, and asset management. Examples: Acorns, Plum (auto-saving); MoneyBox, Nutmeg (robo-funds).
- Payments: Provides domestic and international payment services. Examples: Venmo, Cash App, Zelle (US); PayPal, Wise, Remitly (international remittances).
- Crypto: Offers crypto trading, storage, and management. Examples: Binance, Coinbase, Kraken (exchanges); Trust, Zengo (wallets).
Global Financial App Benchmark Data
- Financial app retention is rising, with stock trading apps having the highest average retention.
- iOS financial app conversion rates are much higher than on Google Play, at 34%.
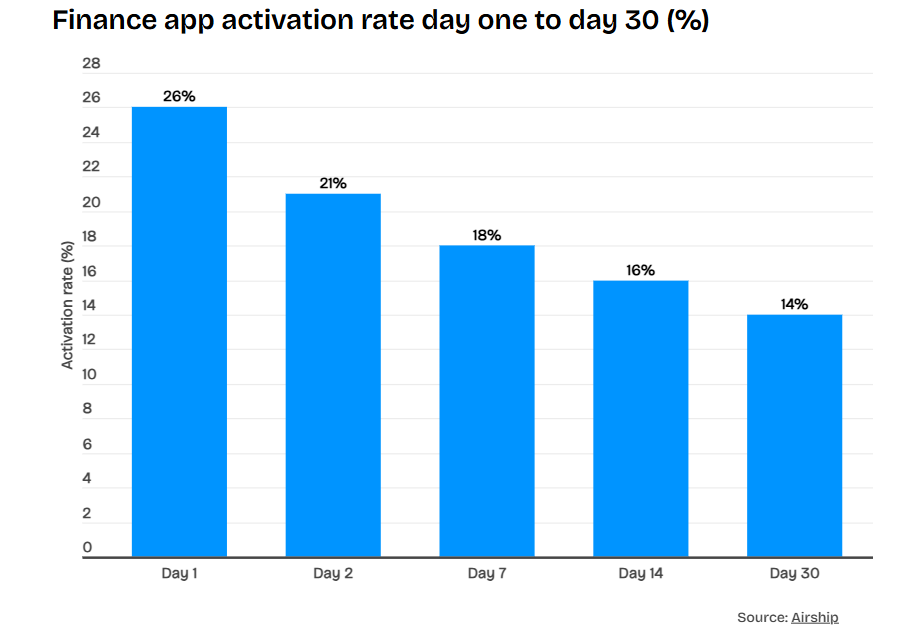
- About 14% of financial app users complete all activation processes by day 30.
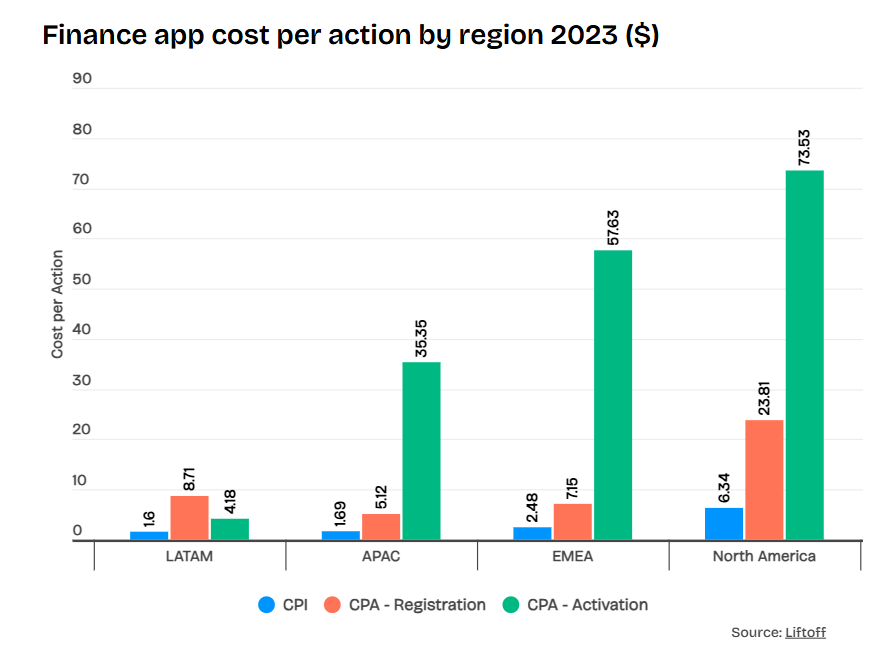
- iOS financial app CPAs are higher than Android's. By region, North America has the highest CPA costs.
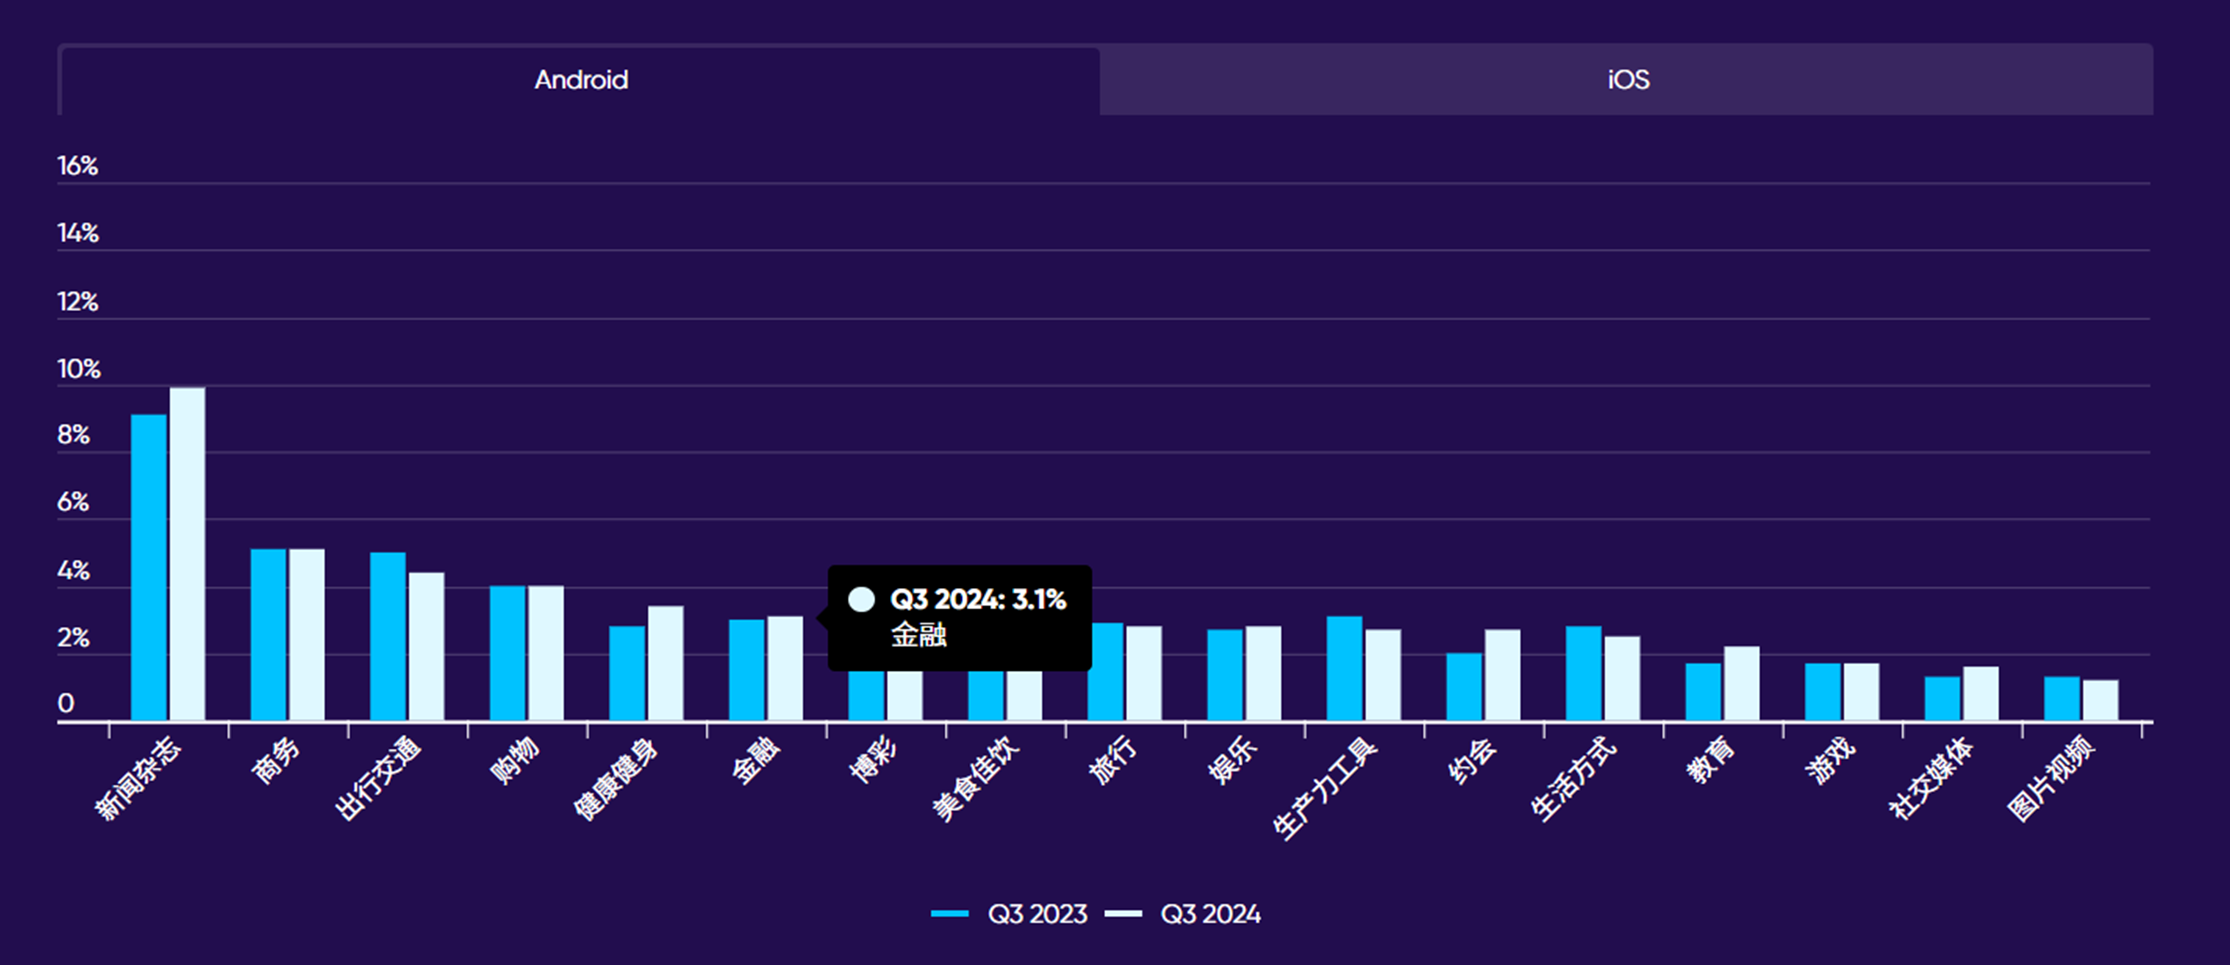
In 2024, global financial app retention improved slightly. iOS retention was 6.6% (up 0.6%), second only to news apps. Android was 3.1% (up 0.1%), ranking sixth among app types.

Stock trading apps have the highest day-after retention (23%), followed by banking (22%) and crypto (19%). Payment apps have the lowest retention.

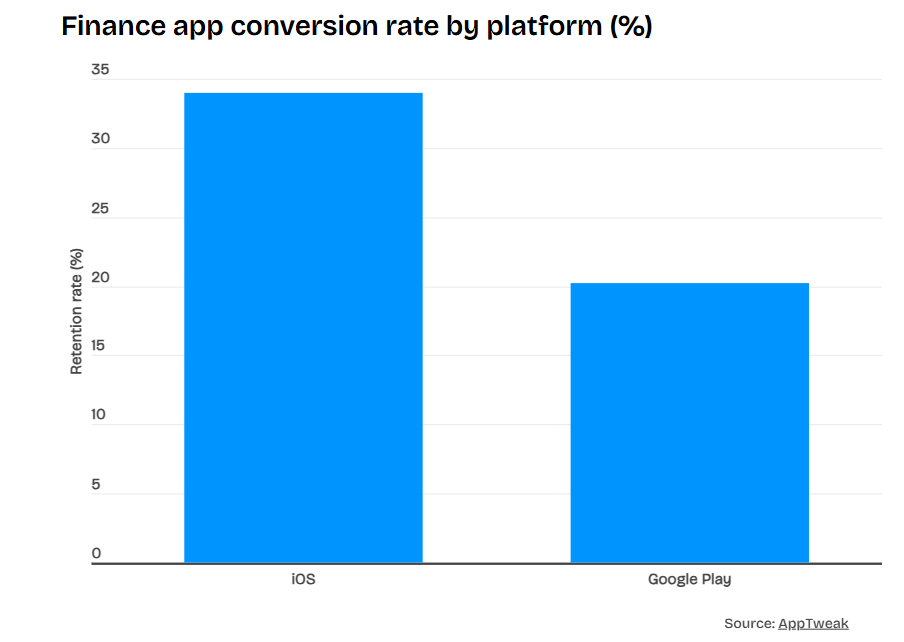
iOS financial app conversion rates are much higher than Google Play's, at 34% versus 20.2%. This is due to iOS users' higher spending power, greater trust in financial apps, and better user experience.
The average activation rate for financial apps drops from 26% on day one to 14% by day 30. Only about one in five users complete the activation process.
iOS CPAs are higher than Android's. For CPA-activation, iOS is $66.90 and Android is $13.17. CPA-registration is next, with CPI averages being the lowest.

Globally, North America has the highest average CPA costs for financial apps, followed by EMEA, Asia-Pacific, and Latin America.
Fintech and crypto apps have longer usage times than banking and payment apps.

Unlocking Financial Apps' Potential
As competition in the global financial app market intensifies, improving user acquisition efficiency, reducing customer acquisition costs, and maximizing long-term user value are key concerns.
- Global Own-Traffic Coverage: With 100 million+ monthly active users across gaming, tools, and social fields, it helps advertisers growth bottlenecks and quickly reach high-quality users.
- Industry-Leading Algorithm Technology: Proprietary algorithms provide efficient user acquisition models, automatically targeting high-value users for better ROAS and cost-effective ad campaigns.
- Professional Operations Team Support: Provides tailored growth strategies and full-service support from UA experts, creative, and advertising teams.
NetMarvel has helped numerous financial app clients achieve significant growth. For more on advertising or app promotion contact us!


